The 7QC tools are statistical tools that help individuals, organizations, and businesses resolve quality issues for products and processes. To utilize the 7QC tools it is important to understand the following essential quality terms:
You can read our other 7QC Tools post here.
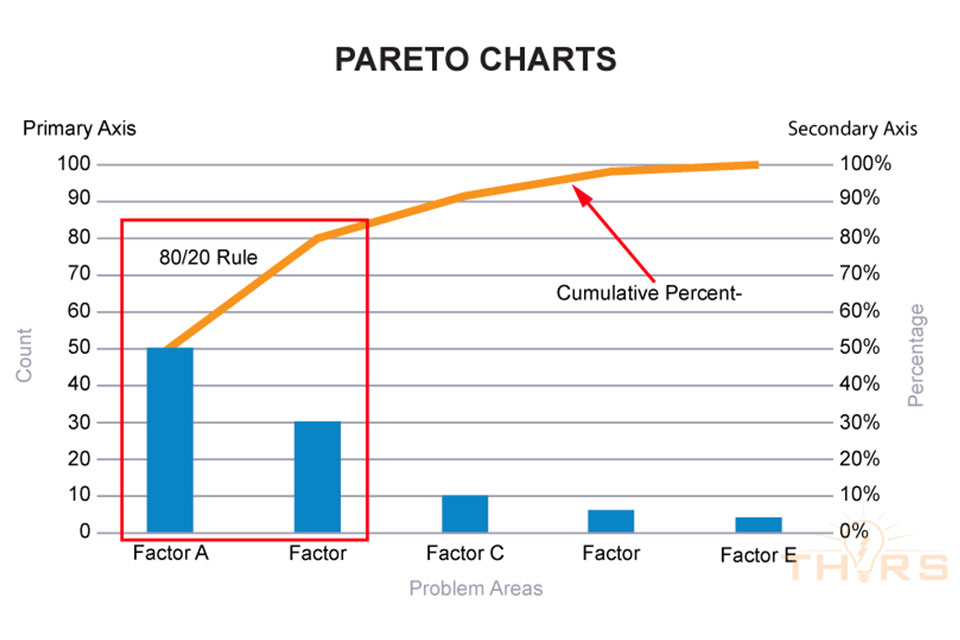
80/20 Rule: The 80/20 Rule, also called the “Pareto Principle,” states that 80% of the problems arise from 20% of the sources.
Average: The average, or mean, of a set of sample data is calculated as the sum of the data points divided by the total number of data points.
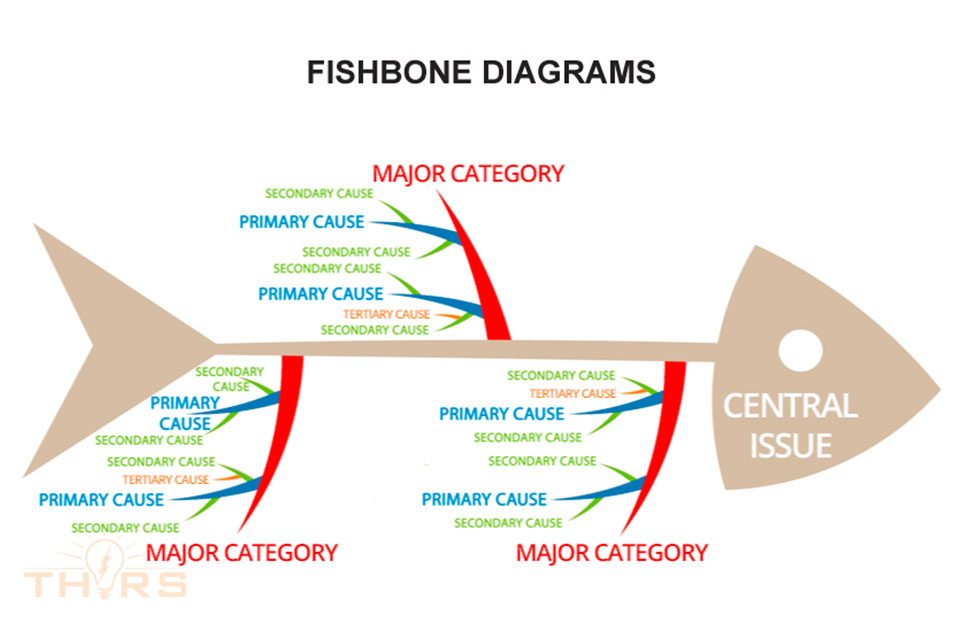
Central Issue: The problem that needs to be solved.
Control Limits: Control limits are defined as the values that represent the maximum and minimum amount of variation that the averages of data points within subgroups of a process can exhibit. When the subgroups exist beyond the control limits or exhibit specific patterns or trends, then the process is said to be “out-of-control.”
Correlation: Correlation is defined as the level of dependency or association between two variables. Most commonly, linear relationships are evaluated using the Pearson’s correlation coefficient, which is a calculated statistical value.
Cumulative Percentage: The cumulative percentage is the running total of each factor summing to 100%.
Dependent Variable: A dependent variable is the variable, or factor, that changes when other variables change. Outputs from a process, or product characteristics, are typically dependent variables.
Five W’s: The phrase “Five W’s” is short form for asking the Who, What, When, Where, and Why questions.
Frequency Distribution: Frequency distribution shows the variation in a given set of data when the data are tallied into groups.
Independent Variable: An independent variable is the variable, or factor, that does not change when other variables change. Inputs to a process, or process characteristics, are typically independent variables.
Intervals: Intervals are the sub-groups into which data are classified in order to construct a histogram. Intervals are always mutually exclusive, meaning the data points that equal the upper limit of an interval can only exist in that interval and not in the next interval.
Major Categories: The major groupings under which possible causes may be sorted to solve the central issue.
Mode: Mode is the value or number that appears the most often in a set of numbers or data.
Normal distribution: Statistically, a normal distribution is represented in a histogram when a smooth, symmetric curve can be generated from the bars where the mean, or average, is the center of the curve and the rest of it tails off to near zero on either side. Normal distributions are a bell-shaped curve.
Paired Data: When two variables are collected jointly such that for each value of the independent variable (x), a corresponding value for the dependent variable (y) is generated, then the data point (x,y) is said to be paired data.
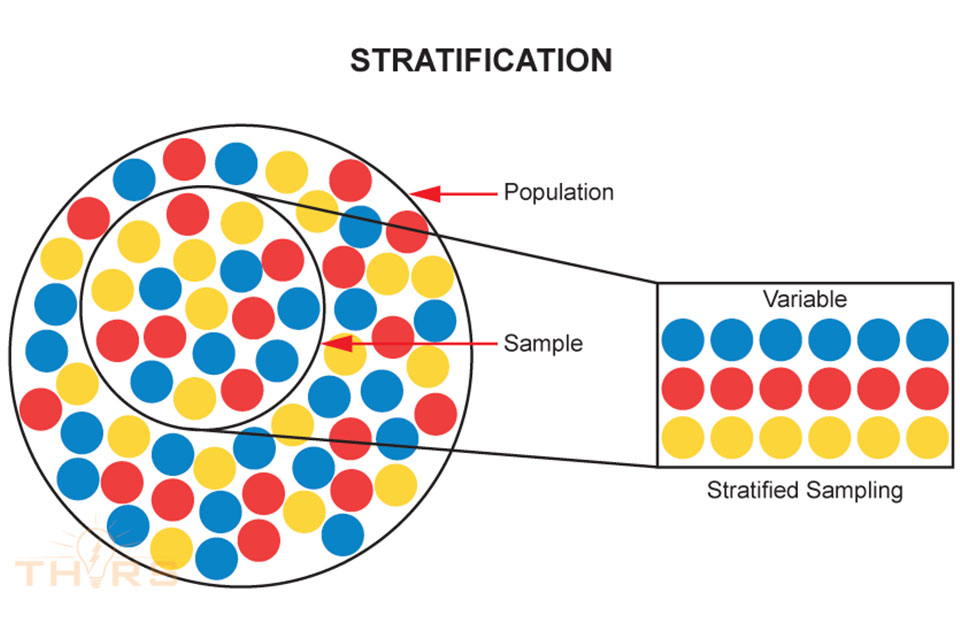
Population: A population is the entire data set under consideration while analyzing data.
Primary Axis: The primary axis is the Y axis on the left side of the graph used to depict the frequencies.
Primary Causes: The principle causes specific to a particular category.
Range: Range is calculated as the difference between the maximum and minimum observed values of a set of sample data.
Sample: A sample is a smaller subgroup of data that is taken from within the population.
Secondary Axis: The secondary axis is the Y axis on the right side of the graph used to depict the cumulative percentages.
Secondary Causes: The causes derived from the primary causes after further brainstorming.
Standard Deviation: Standard deviation is defined as the amount of variation that exists within a sample data set. The Greek letter “sigma,” σ, is used to represent standard deviation.
Stratified Data: When collected data show tendencies of being divided into more than one subgroup, then the data are said to be stratified.
Stratified Sampling: Stratified sampling is the method of collecting and sorting data from a population into smaller logical segments after sampling takes place.
Subgroup: Subgroup is defined as a small collection of data points, typically between 2 and 10 data points, that are compiled together within a short interval of time. The average of the data points within a subgroup is represented as a single dot in the control chart.
Tally Marks: Tally marks are used to determine quantity. Each tally mark represents the value 1, where I = 1. When the amount of tally marks reaches 5, the fifth tally mark strikes across the previous 4 marks to be recorded as a fifth tally, ||||. The tally marks continue as single tallies until the next multiple of 5, the value 10, is to be recorded, |||| ||||. [Put slashes across the 4 tallies here and at the 5 location.]
Tertiary Causes: The causes derived from the secondary causes after further brainstorming.
Variable: A variable is a type of characteristic that can be used to separate/segregate data into groupings that affect a given process or outcome, and it can change according to outside influences like time, place, and standards.
To learn more about these Seven Basic Tools of Quality Control, and to learn how to apply these tools to solving quality problems by viewing examples, check out the online 7QC courses in the THORS Academy Library, brought to you by THORS eLearning Solutions.